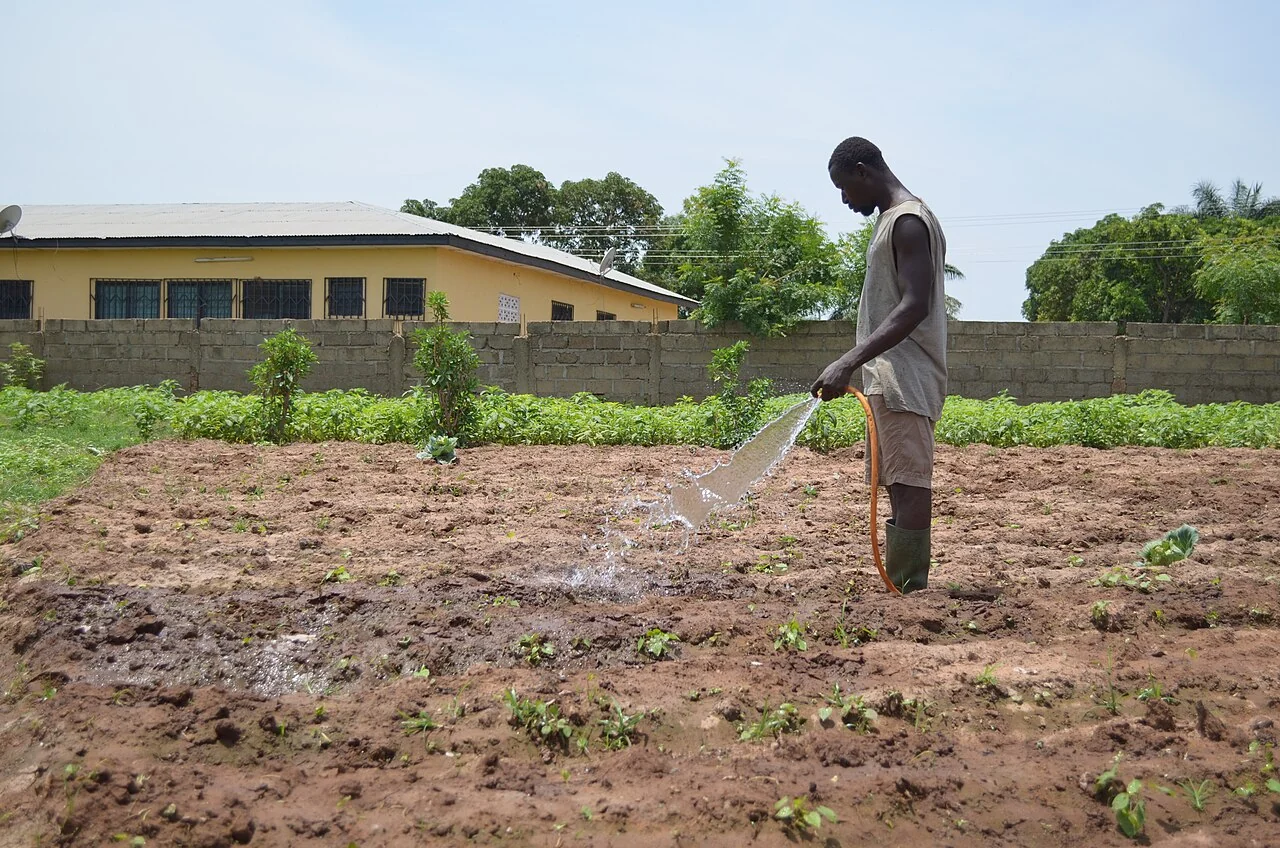
Start with the operational question
Use the near-infrared and shortwave-infrared relationship as contextual information on canopy moisture-related variation. Review rainfall, crop stage, and ground observations alongside the map.
Separate observation from explanation
A canopy moisture index is not a soil-moisture sensor and does not directly tell an irrigation operator how much water to apply. Bare soil and mixed cover complicate the signal.
Connect the canopy signal to the water system
Draw a simple picture of the water system: rainfall, irrigation delivery, storage, runoff, drainage, soil conditions, and crop use. Identify which parts are measured and which are modelled or inferred. An observation of standing water, a soil-moisture reading, and a canopy moisture-related index describe different parts of that system and should retain their own units and dates.
Plan field checks around contrasts that could test the proposed explanation. Inspect upstream and downstream locations, irrigation heads and tails, different soil or terrain positions, and areas with similar crops but different symptoms. Record recent rainfall and operations. If a sensor is used, document placement, depth, maintenance, calibration information, and whether it represents the surrounding field.
Use imagery to organise investigation and monitor patterns over suitable dates. A map alone should not become a universal irrigation amount or drainage instruction. Local agronomy, system capacity, safety, and environmental requirements shape the response. After an intervention, record what was done and compare later observations while acknowledging weather and management changes that may also explain the outcome.
Read article: NDRE and red-edge bands in crop monitoring
Match spatial detail to the question
Agricultural GIS connects field boundaries, observations and imagery, but each dataset has its own spatial support. A point marks a location, a polygon describes an area and a raster pixel summarises a footprint. They should not be treated as equivalent measurements. Before overlaying layers, check their coordinate reference systems, dates and units. A visible alignment problem can arise from a coordinate or georeferencing issue rather than movement or change in the crop itself.
Sentinel-2's bands have different native spatial resolutions. Its visible and broad near-infrared bands are available at finer resolution than its red-edge and shortwave-infrared bands. Resampling can put those bands onto a common grid, but it does not create new observed detail. When a field is narrow or small, boundary pixels may mix crop with roads, trees, water or neighbouring land. Explain that mixture before interpreting a field average as a pure crop measurement.
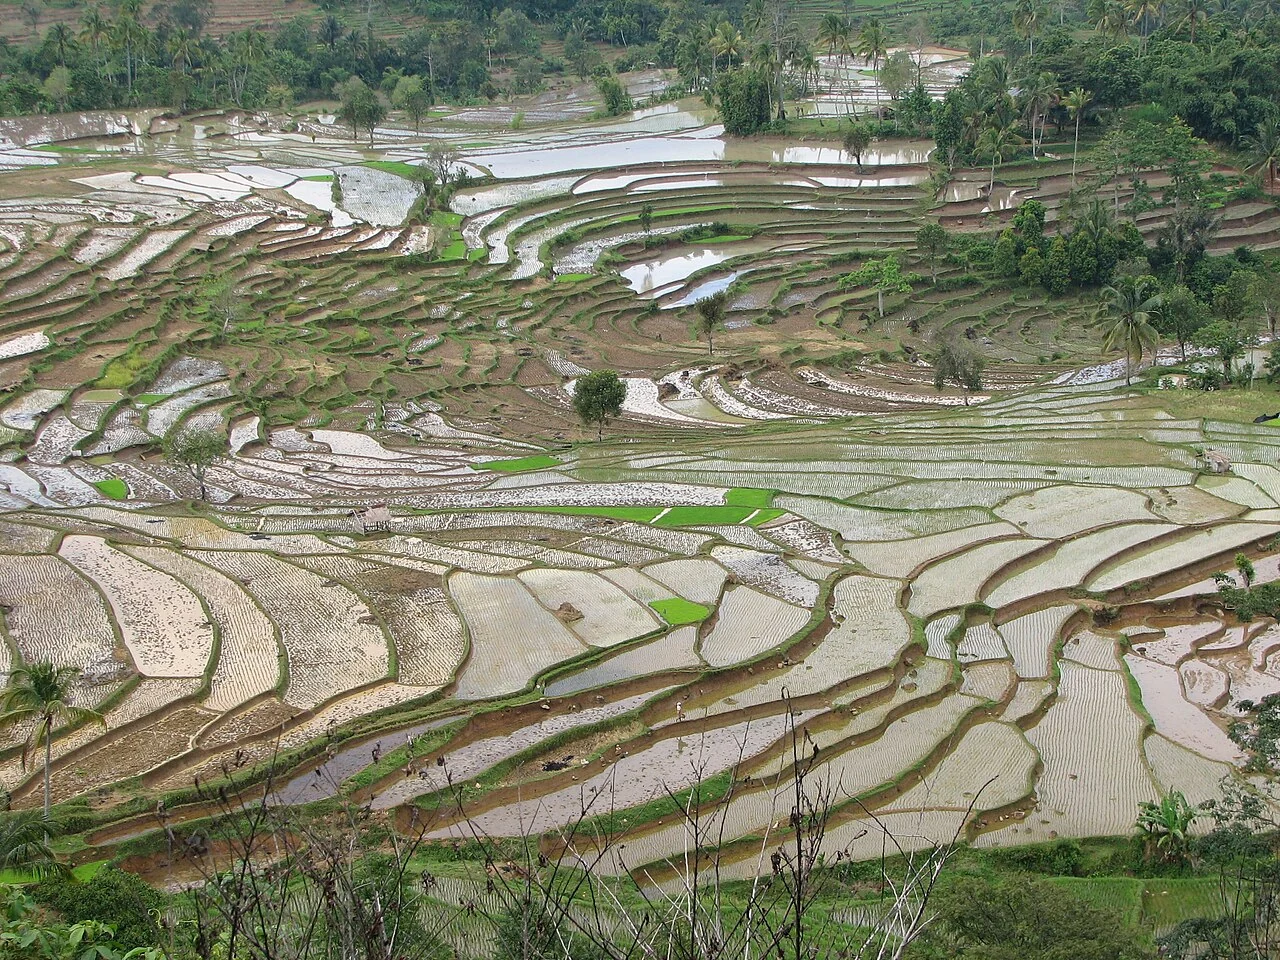
Preserve quality and time information through the analysis
Optical imagery requires attention to clouds, haze and shadows. A scene with a small overall cloud percentage may still have the target field obscured. Inspect the actual area of interest and retain the masking or quality method used. Compare compatible products and document processing choices, especially when building a time series from different dates or sensors. An unexplained jump may be a data-quality issue rather than a sudden change in vegetation.
Vegetation indices describe combinations of reflected spectral signals. USGS explains that NDVI is sensitive to soil background and can saturate in dense vegetation. Therefore an index is best interpreted with crop stage, canopy structure and field evidence. A colour class is not a direct measurement of nutrient concentration, disease identity or harvestable yield. Those interpretations need suitable calibration and validation, and any prediction should retain its uncertainty and the conditions under which it was evaluated.
Make maps reproducible and useful for the next observer
Keep the original inputs, analysis date, method version and relevant parameters with the output. Use a clear legend that distinguishes observed values, derived indicators and unverified candidates. Where a statistic excludes cloudy pixels or non-crop areas, document the exclusion and the valid coverage. If the coverage changes between dates, acknowledge that the averages may represent different parts of the field. This is especially important when a report turns a sequence of maps into a trend.
Design the validation around the intended use. A model for one crop and season should be tested on independent examples that represent the conditions where it will operate. Field checks should look for missed objects as well as incorrect proposed objects, and classification checks should include each meaningful category. Retain the disagreements and review their causes rather than removing difficult cases. A map becomes operationally valuable when another person can follow its evidence, understand its limits and decide what observation is needed next.
Design reference observations that represent the field
State the population that the sample should represent and the question it must answer. Select locations across relevant crop stages, terrain, management, and image conditions. Include ordinary areas and difficult cases, not only conspicuous anomalies or convenient roadside stops. Record selection rules so that later users understand where the reference is representative.
Define the observation unit, area or depth, timing, instrument or laboratory method, and required replicates using the appropriate discipline's protocol. A point observation and a satellite pixel have different spatial support. Record enough context to evaluate that mismatch. Keep inaccessible sites in the sampling log and explain any replacement rather than silently dropping them.
Separate reference collection from the result being evaluated when feasible. Review observer consistency and missing data before calculating agreement or error. Retain raw observations, corrections, and exclusions with their reasons. More samples can improve precision, but a large biased sample still fails to represent excluded conditions. Use the results within the population and period that the sampling design supports.
Read article: Clouds, shadows, and usable satellite observations
Read a time series as dated evidence
Keep the actual acquisition dates and the usable observation count. Plot management events beside the series and inspect gaps instead of allowing a smooth line to imply continuous measurement. A composite or interpolated value should be labelled with its method and temporal support. It may summarise several dates rather than describe one moment.
Compare similar crop stages and management histories. Align by planting, cutting, pruning, or another relevant event when calendar dates would mix different stages. Check that the field boundary, sensor treatment, scale factors, and quality rules are consistent. A processing or geometry change can create a break that has no biological cause.
Examine the original imagery around unusual points and seek corroboration from another usable observation or the field record. Distinguish persistent changes from single-date outliers. Report the period that can actually be observed and avoid estimating an event date more precisely than the data support. Preserve uncertainty around cloudy intervals or periods with no suitable ground reference.
Define the deliverable and approval
Deliver a moisture-investigation layer with dates, quality masks, comparison groups, rainfall context, and a field measurement plan for testing the proposed explanation.
A practical review before sharing the result
Check the observation against its source and make sure the field identifier is correct. Review dates, units, missing values, quality exclusions, and geometry versions. Ask a colleague to reproduce one representative result from the recorded inputs. This small independent check often exposes a misunderstood field code or a processing assumption before it affects an entire report.
Write down the alternative explanations for the mapped pattern and identify what evidence would distinguish them. Keep a measured observation separate from the interpretation and from any treatment or management instruction. A decision should name its responsible reviewer and account for local operating procedures. If the evidence is insufficient, the appropriate output is a targeted inspection rather than a confident claim.
Keep the original result, any reviewed version, and a short change log. State which locations and periods the output can reasonably describe. When sharing a map, provide a clear legend, source dates, and an accessible explanation of uncertainty. The recipient should know whether a feature is a confirmed observation, a candidate awaiting inspection, or a model-based estimate.
Read article: NDVI for agriculture: useful patterns and common mistakes
Turn the investigation into a repeatable field cycle
Prepare the visit with a map that can be used at the intended location and a concise list of questions. Confirm access, permissions, equipment, and the availability of a person familiar with the field. Choose representative stops as well as unusual areas. Record where the planned route could not be followed, because missing observations can change how the result should be interpreted.
After the visit, review the observations while the team can still clarify them. Connect photographs, measurements, and comments to the same field and visit identifiers. Assign a follow-up status and preserve unresolved cases. A correction should explain what changed and why; it should not erase the original evidence or make an earlier interpretation appear to have been certain.
At the next suitable observation date, compare conditions using the same definitions and review any management or weather events that occurred between visits. Record the action actually completed and its operational outcome. This creates an evidence trail from an initial pattern to field confirmation and later review, making the mapping process easier to improve over successive seasons.
Connect this work with AgroSensing
Use a connected spatial workflow to organise imagery, commodity records, and geolocated field observations. Discuss the appropriate data, validation, and operating scope with the team.
Sources and further reading
The linked primary references explain the underlying agronomic and geospatial concepts. The field workflows in this guide are editorial recommendations to adapt with the responsible local specialist.